My Reflection of Voyant
Voyant is a text visualization project that facilitated me the analysis of content appearing in the WPA Slave Narratives Project that took place in the late 30s.
It is a virtual environment that allowed me to engage in the reading and analysis of digital texts collected and edited during the WPA interviews. Even though it is academic in nature, this tool is available to academics as well as to members of the public. It comprises five panels of ways of studying and making interpretations of text from a linguistic point of view. The Cirrus panel visualizes the frequency of terms within the corpus or within each document within it in the form of a word cloud. Users can make use of the Summary panel to instantly show the total number of words each WPA document contains (i.e. the Georgia document, the Kansas document, etc.), its lexical richness, and its textual distribution. It also helps us see distinctive terms and draw comparisons between different documents within the corpus.
While the Context panel lets us study the concordances of each word and the context surrounding it, the Trends facet gives us a graphical representation with respect to the distribution of a word throughout the document or the corpus. The Reader panel showcases segments of text where words of interest can be located and studied.
These five Voyant tools are ideal for experts and non-experts, as it is fairly easy to use, highly interactive and customizable, depending on what type of linguistical data we want to project.
A Non-Expert User’s Guide to Voyant Tools:
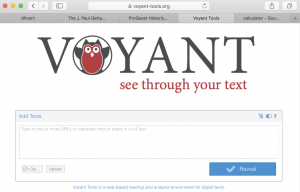
Step 1: Open a window in your browser and visit Voyant-Tools.org
Step 2: Create a Corpus
In order to start analyzing content with Voyant, you must first create or identify the corpus (or document) that you will use. You could do this in several ways using the Voyant-Tools.org text box panel.
From this page, you may do one of the following:
a. Copy & paste or type an existing corpus onto the Voyant.tools.org main text box (great for shorter documents)
b. Open an existing corpus by using the Open (with folder icon) link and selecting from a list
c. Type the URL or URLs into the text box (each one in a separate line; you must select URLs that are not residing behind a firewall)
d. Upload the file or files from your computer by clicking on the Upload link (great for longer documents; you may want to create a zip file when working with several files)
Voyant can read the following formats of files:
- Plain text
- HTML
- RTF
- XML
- Microsoft Word
For this activity, we will use The WPA Project on Slave Narratives
The WPA Slave Narratives (1936-1938) are a series of interviews (more than two thousand) with former slaves conducted by the Federal Writer’s Project, a unit of the Works Progress Administration (WPA). It is a corpus comprised of seventeen documents, each one pertaining to the transcripts collected from the state were the interviews were conducted. This case offers a great example to show how to best bring your corpus/text to the Voyant Tools platform.
I can make use of the different Voyant tools to read and examine content and answer questions like:
-“What is the most frequent word used in the Florida document?”
-“What are the most distinctive words in the Missouri document, and, how do they compare to the narratives collected from the Texas document?”
-“In what context was the term ‘corn’ used in the corpus? How about the corpus in comparison with the Kansas document?”
-“In what segment of the Maryland document, is the word ‘plantation’ used? In which contextual instances is it used the most?”
-“Which document contains the highest words/sentence ratio?”
This corpus being a collection of seventeen documents, with a substantial amount of information, is the ideal data set to practice with Voyant as it will allow you to compare a narrative from one state to another, or to the corpus in general.
Practice Time:
Let’s add a corpus to Voyant by using the a collection of WPA plain txt files.
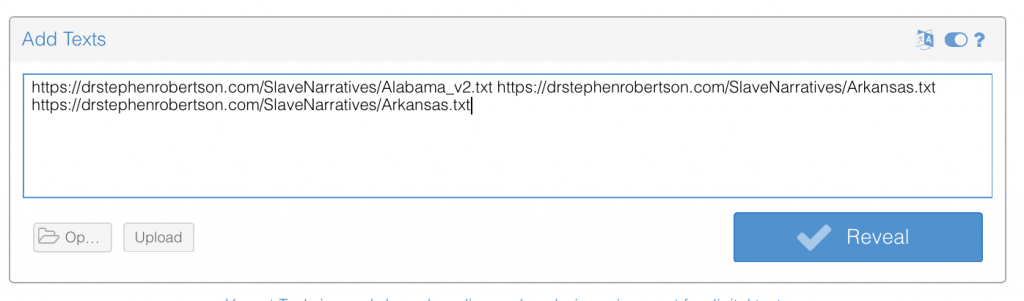
Remember, for each URL (document), you need a separate line. So, copy and paste the first file (the Alabama document) on the first line in the Add Texts box, then hit “enter” or “return” on your keyboard to place your cursor on the line below.
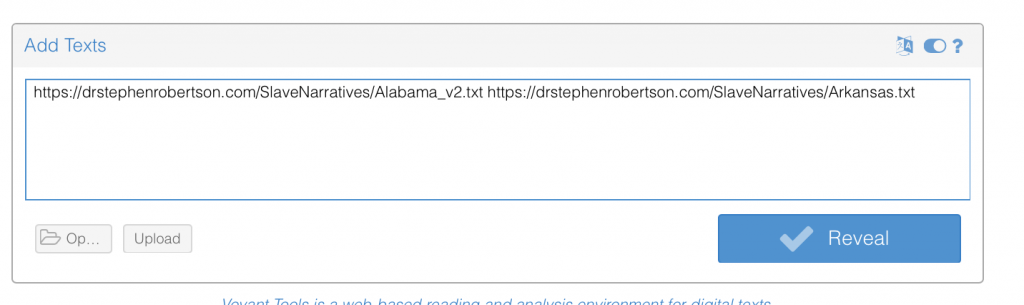
You may copy and paste several URLs onto the Add Texts box. Just make sure that each line begins with the “http” part of your links
Here are the seventeen documents that you would need to copy and paste onto the Add Texts box.
https://drstephenrobertson.com/SlaveNarratives/Alabama_v2.txt https://drstephenrobertson.com/SlaveNarratives/Arkansas.txt https://drstephenrobertson.com/SlaveNarratives/Florida_v2.txt https://drstephenrobertson.com/SlaveNarratives/Georgia.txt https://drstephenrobertson.com/SlaveNarratives/Indiana_v2.txt https://drstephenrobertson.com/SlaveNarratives/Kansas_v2.txt https://drstephenrobertson.com/SlaveNarratives/Kentucky_v2.txt https://drstephenrobertson.com/SlaveNarratives/MIssissippi_v2.txthttps://drstephenrobertson.com/SlaveNarratives/Maryland_v2.txt https://drstephenrobertson.com/SlaveNarratives/Missouri_v2.txt https://drstephenrobertson.com/SlaveNarratives/NorthCarolina.txthttps://drstephenrobertson.com/SlaveNarratives/Ohio_v2.txt https://drstephenrobertson.com/SlaveNarratives/Oklahoma_v2.txthttps://drstephenrobertson.com/SlaveNarratives/SouthCarolina.txthttps://drstephenrobertson.com/SlaveNarratives/Tennessee_v2.txthttps://drstephenrobertson.com/SlaveNarratives/Texas.txt https://drstephenrobertson.com/SlaveNarratives/Virginia_v2.txt
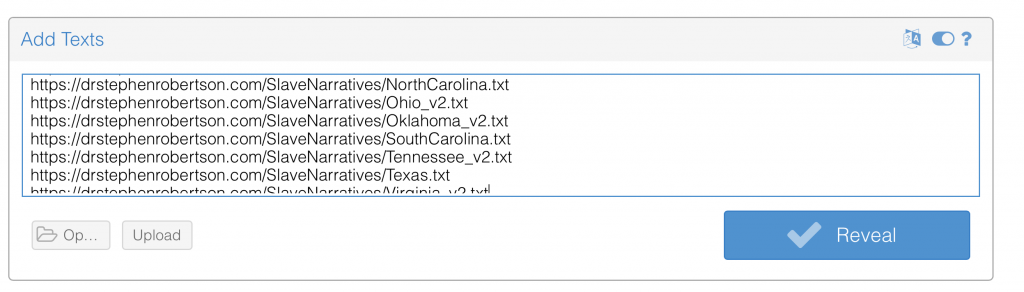
Step 3: Click on the “Reveal” Button to see Corpus Represented on the Voyant Tools Page
Once you select your corpus and pasted it onto or typed it on the text box area, you will then select the “Reveal” button to start seeing the corpus represented. You will see five ways of representing the data in a landing page (called Default Skin), which includes a series of panels: Cirrus, Summary, Context, Trends, and Reader.
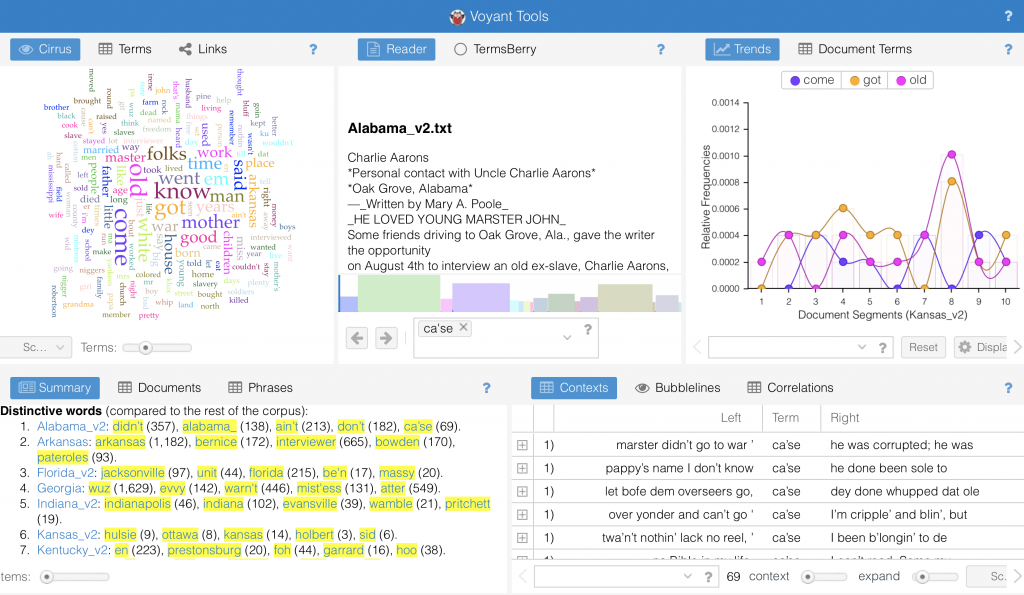
Cirrus
The Cirrus panel visualizes the frequency of terms within the corpus or within each document within it in the form of a word cloud.
You can ask yourself various questions, for instance: the most commonly used word in the corpus or the top 20 words used in the corpus.
Options for what and what not to see
You may slide the Terms slider under the cloud to adjust the number of words you would like to see, or use the Scale section to choose to see the word cloud at the corpus level or at the document level.
You’ll see additional options on the top menu, right above the word cloud to edit the list of stopwords of function words that do not carry the same meaning as other frequent words (prepositions, conjunctions, etc.). You could also export the word cloud in case you would like to preserve it or present it.
Summary
The Summary panel instantly shows the total number of words each WPA document contains (i.e. the Georgia document, the Kansas document, etc.), its lexical richness, and its textual distribution. It also helps you see distinctive terms for each state document and draw comparisons between different documents within the corpus.
Because our corpus has multiple documents, this Summary panel will show the words that are not just high frequency, but also, how distinctive words in each state compare to each other.
Context
The Context panel lets us study the concordances of each word and the context surrounding it. This panel is basically a table that includes the following: (1) the document title where the word is located, (2) the contextual phrase that precedes the word of interest, (3) the word itself, and (4) the phrase that follows the word of interest.
Feel free to expand the rows and columns to have a better view of additional context. You may also make use of the search bar (underneath the table) to select terms to be represented.
Trends
The Trends panel generates a graph that showcases the distribution of the frequency of the word used in the document or segment of document. Each line on the graph is color-coded to represent a different word.
There are two types of frequencies you can choose from to have appear on the y-axis of the graph: relative frequency (per 10 million words) and raw frequency (absolute count for each document/segment). Users may find this option helpful when dealing with dealing with large corpora with uneven document length.
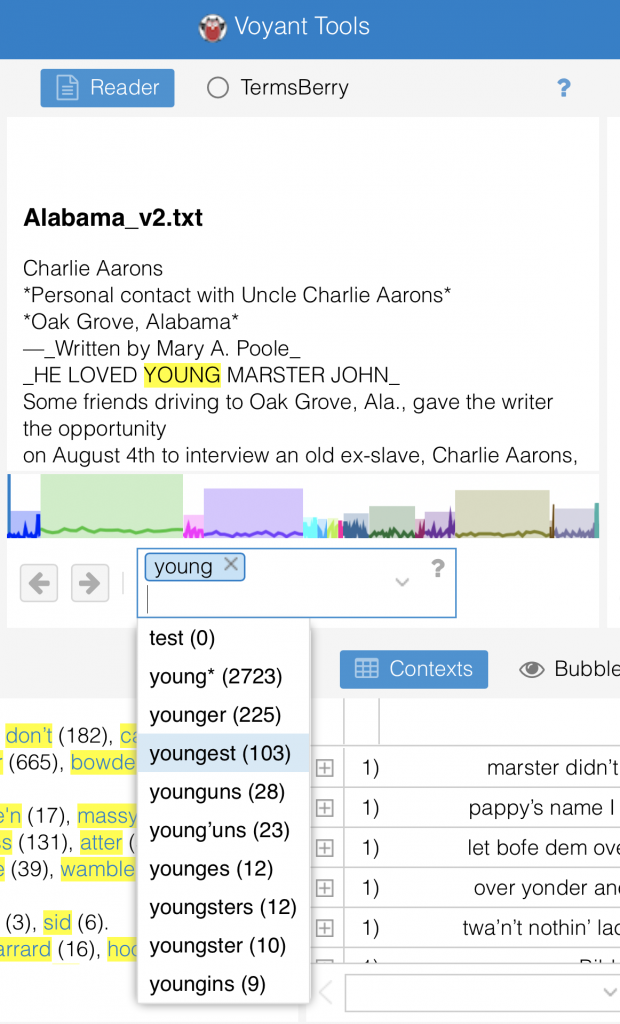
Reader
The Reader panel lets you read the document being examined. You may scroll down to explore more content, and hover over a word to see it frequency in the document. You may type a word of interest in the search box provided below the panel.
Practice Time
Let’s see how we can make our experience with Voyant more interactive.
Making use of one of the panels can change what you see in the other panels.
Under the Summary panel, look for the section Distinctive Words and look for the word “ca’se”, which appears in the Alabama document.
Click on that word.
Now watch how the Context and Reader panels change to reflect data coming just from the Alabama document.
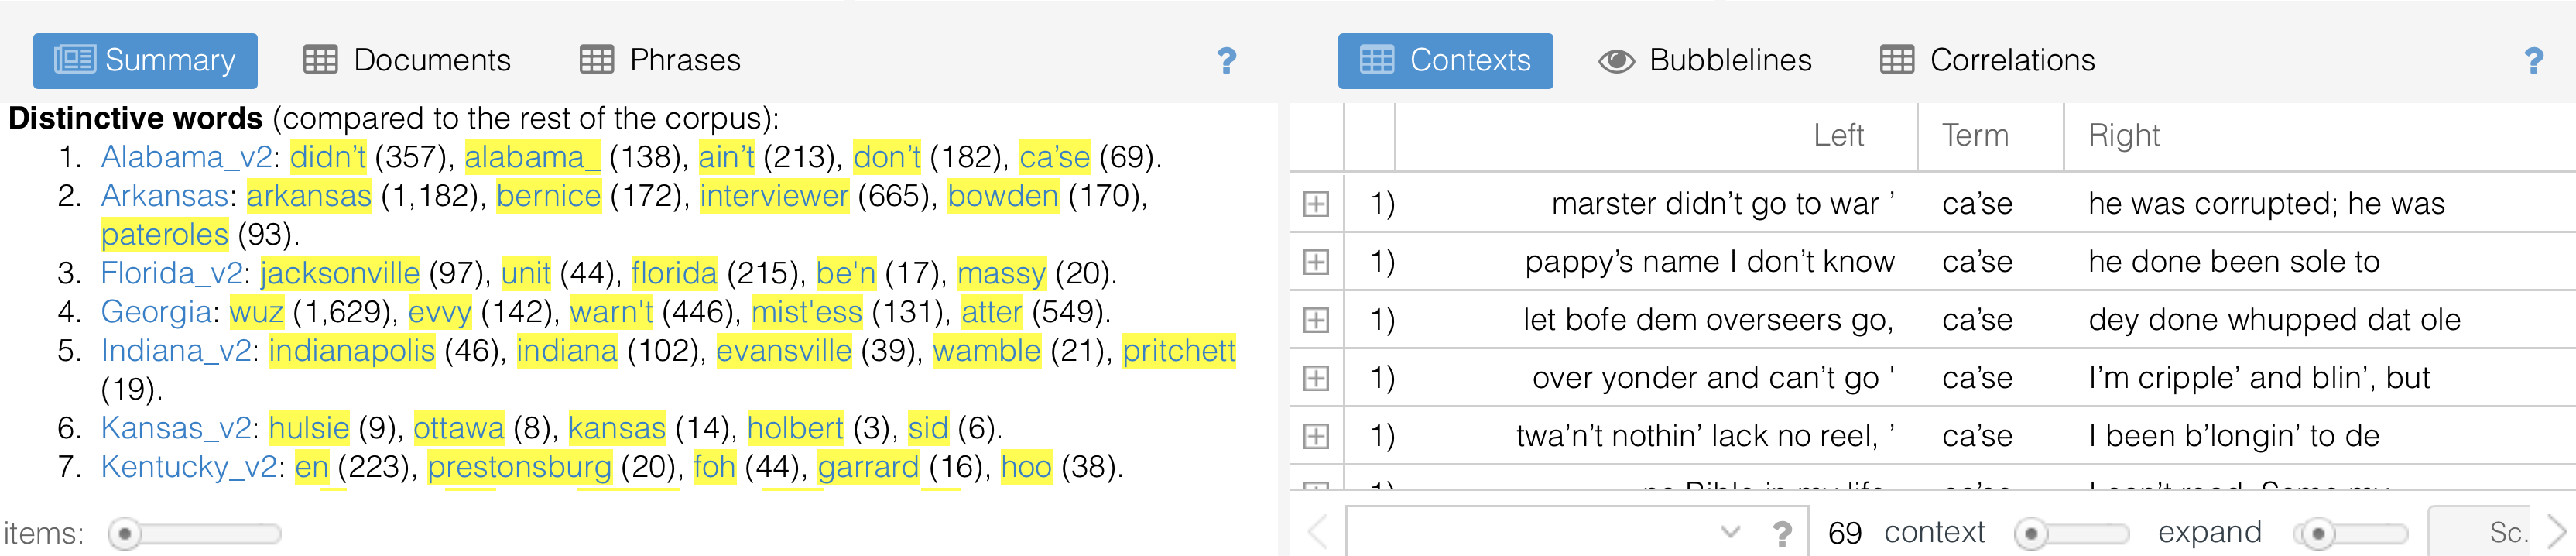
Notice how Context panel will show the context surrounding the word ca’se. Adjust the rows to have a better appreciation of the context surround that word.
Now take a look at the Reader, which will point you to segments on the document, where the word “ca’se” is used.
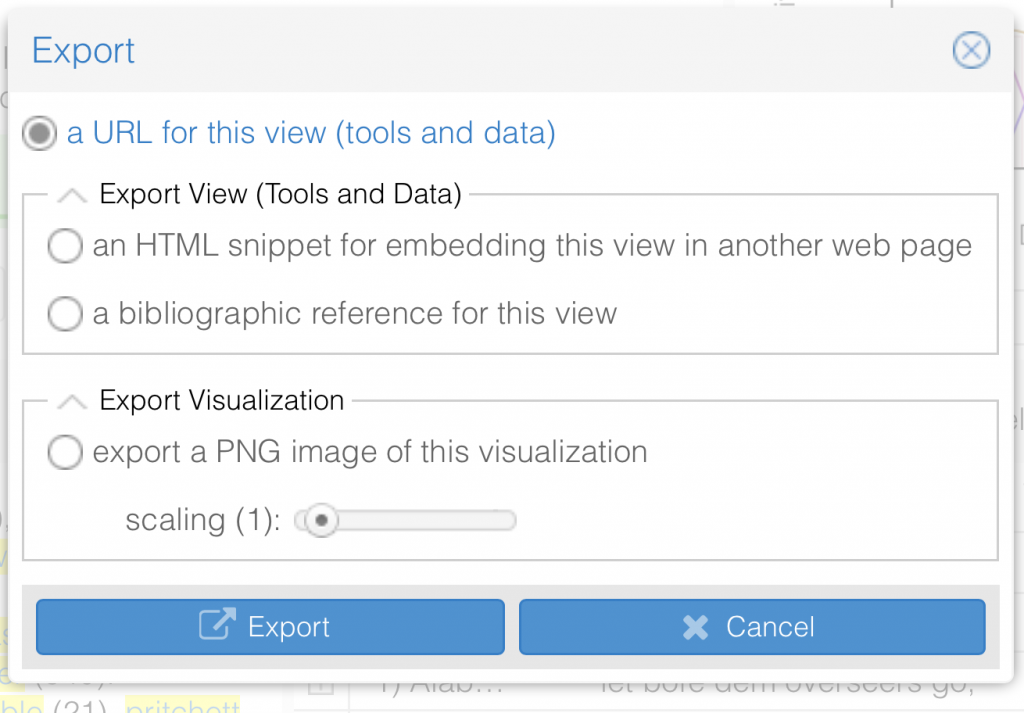
Export Visualizations
There are a few ways you may keep your visualizations from each one of Voyant five panels.
a. Sharing the URL of the entire Default Skin (all five panels)
You may do this by clicking on the “Export” (diskette) icon in the blue bar on top of the page
b. Exporting the URL of one of the panels
You may do so by clicking on the “Export” icon in any of the panels. From here, you’ll have two choices:
Option 1: The Export View will give you the options embedding the HTLM snippet of the view in another web page, or creating a bibliographic reference for this view.
Option 2: The Export Visualization will let you export a PNG image of the visualization of interest.
Guía en Español (coming soon)